
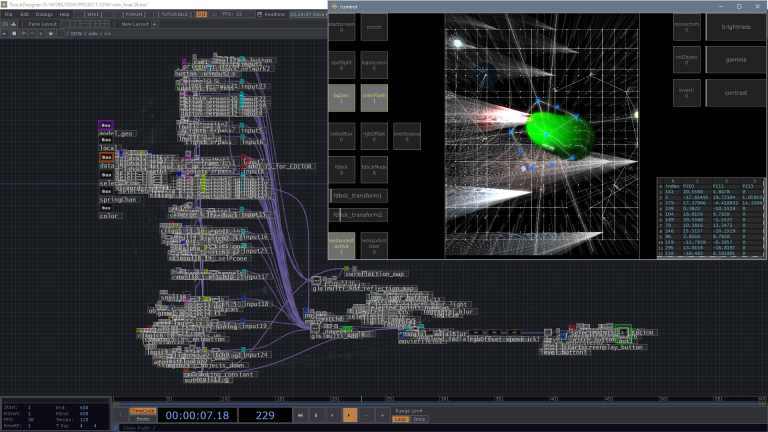
Building CNNCTR was a challenging process. It took time to experiment with data and geometry in TouchDesigner – the project folder contains 586 .toe save files at all. And there were some different levels of interactivity which I was working on. The final network pipeline was running simultaneously several types of real-time processing setups. Some of them were triggered randomly by the system itself, the audience was able to trigger others by the CNNCTR mobile app and I was also able to trigger and control events by other interface. So let’s cut this project into components and walk through them.
One of my favorite abilities of real-time rendering software is to generate random stuff in a given threshold. This obsession started during my academic study when I was experimenting a lot with mixing incompatible painting techniques. My professor Krassimir Valkanov was talking about “the method of the controlled randomness” and since then I started to implement this technique almost anywhere.
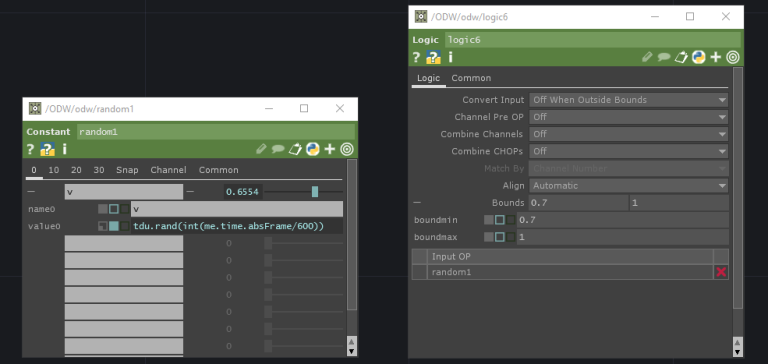
In CNNCTR I did a CHOP component which randomly triggers events. In its core is “tdu.rand(absTime.frame)” – a Python magic which gets a unique random number at each frame. Simple and cool, this expression gave me enough unpredictable data flow in my stream. After it I placed a Logic CHOP set to “Off when outside bounds”. So if I change the bounds in the parameter I could increase or decrease the chance to get a bang. Downstream there were more Math, Trigger, Logic, Filter CHOPs for more precise control depending of the circumstances. I did few components on this principle and I referenced bangs to other parameters like color gamma, switch geometry, switch rendering, animation channels.
Furthermore I did more types of CHOP components which generated numbers. They were based on Spring, Noise, Wave CHOPs and I used them to transform, scale, rotate geometry, make colors pulsate, add objects and so on… Sometimes CHOPs could create complicated relations at each other but what’s better than a math porn? It gets even more exciting with DATs included! But I will not dive into details about this… Let’s talk about SOPs and TOPs and how the world looked like.
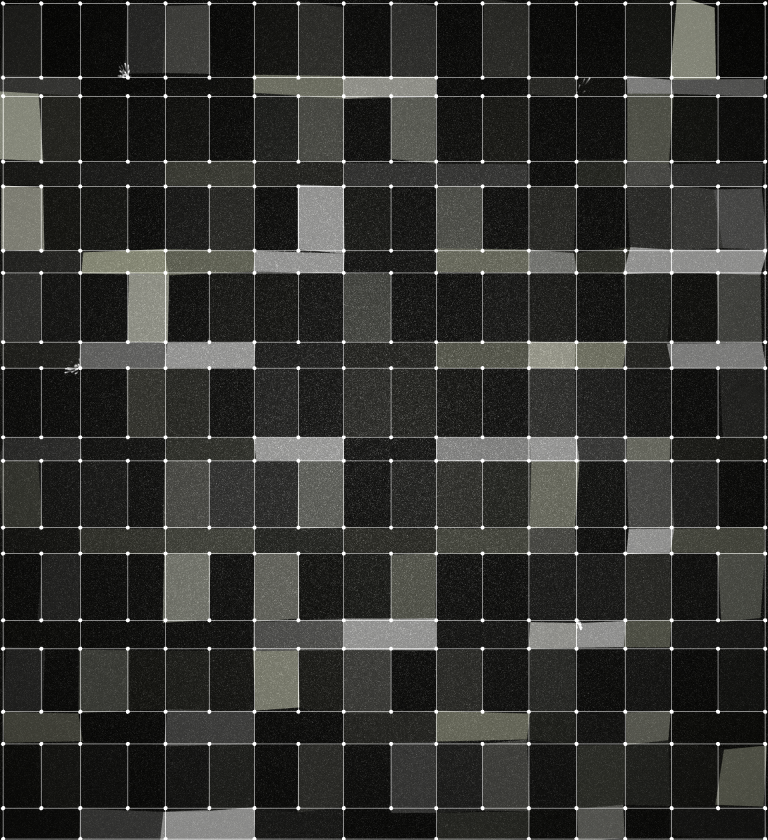
Let’s start from here – what we see if no user is connected yet by the CNNCTR app? There is a faceted polygonal mesh and a grid with instanced spheres at each point (“the points” which users could move once they connect). The mesh surface is illuminated and it’s constantly moving very slightly in a noisy manner. And all this is mapped physically on the architecture of the building. There is also a noise texture as a background environment and sometimes an echoed color lightning occurs to change the palette for a moment. And variable number of grid points are generating particles.
This is the background landscape of the abstract world of CNNCTR and I also did objects (creatures) as part of it. They behave independent based on the random numerical data generated by CHOPs networks and a user can’t control them. A flock of red glowing particles (“fireflies”) and a blue glowing circular spot (“flashlight”) are flying around and coloring parts of the mesh. A group of instanced tailed spheres (“free points”) is falling down and changing randomly its color glow, speed and X-coordinate direction. And there are two more (unnamed) groups – strings of tailed spheres or cubes connected by curved wires, flying either up or down and changing randomly their size, rotation, color gamma. All those objects are triggered at random time intervals less or more often. But there is a rule – it’s not possible for more than one type of objects group to exist at the same time so they have to wait each other in line. Except the red fireflies and the blue flashlight which are constantly alive.


All of this is how CNNCTR lives by itself but what a human connection may change? When an user gets connected by the mobile app he receives a random point from the 335 points grid. The point indicates itself for 5 seconds by forming springy circles and triggering wired cones from it (“spotlight rays”). Then it starts to glow and to generate particles. So the user could move it around by actually moving the point on his mobile device. Furthermore the status of each user is changing while he acts. The more he moves his point it gets brighter and bigger and able to add new connections with other points around. And finally one of the brightest points generates new 3D objects from it.


On each 3 users connected a special event occurs – for 7 seconds the centroids of all mesh polygons generates rotating lines. On each 6 users the centroids generates rotating boxes. And on each 9 users – strings of spheres flowing forward and backward in Z-coordinate. These special events are something like community rules for the users and also an indication for the society growing.


Technically all user interactions is happening by receiving few variables from each user in a Websocket DAT. Then I convert them into a table and append names:
- INDEX – A given random number between 0 and 334 corresponding to the index of a point from the grid
- P(0) – X-position of the point which the user can change by moving the point left and right on the touch screen
- P(1) – Y-position for up and down direction
- P(2) – Z-position. The touch screen is flat so it can’t really has “z” but this variable increases depending of how far the user moves the point from the center of his screen field
- R,G,B – Corresponding to red, green, blue. Each point comes with a constant color glow which is a given random value as well as the point index is. R,G,B variables could be either “0.6, 1, 0.5″ or “0.4, 0.8, 1″ which means that the possible point color could be either blue or green
- TIME – Starts at 0 and increases +1 at each 10 seconds if the user hold and move his point. If he drop the point TIME returns to 0 again. Maximum TIME is 5
As you can see the user has direct control to the XYZ-coordinates of a point and his status is changing in the TIME variable. The more TIME increases the brighter the point glows and the more particles it generates. Furthermore the points with greater TIME values are making more thicker connecting lines with neighboring points as they move close to them. To achieve this I used a custom cPlusPlus CHOP shared in the forum by Vincent Houzé (it’s a Plexus-like effect in TD). And finally if a point becomes TIME=5 it starts to generate new 3D objects from it – SOPs geometry which could be either boxes, spheres, superquads or metaballs. And there are some real-time transformations applied to them by Clip SOP, Copy SOP or Noise SOP. The new objects are free to fly around for 10 seconds and then they disappear back in the point from which they were born. Only one (random) point could generate a new object at the same time, the others TIME5 points have to wait in line. According to this rule it’s not possible to have more than one “huge object” simultaneously. But all TIME5 points have equal chances to generate objects so it’s a question of luck which one will.


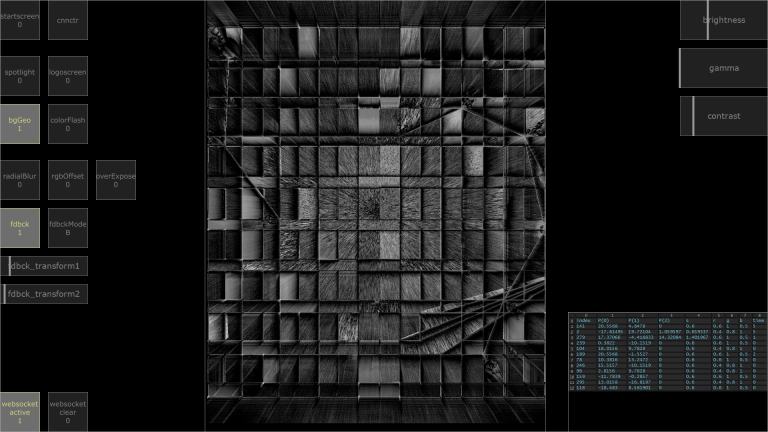
After I created CHOPs and DATs data networks and tied SOPs geometry together, I decided to add TOPs post-effects. I imported some of my VJ-ing components in CNNCTR and chose which are suitable. The results I got were so different if I just tweak parameters and I liked to experiment in real-time with this. So I added some UI buttons and sliders for live editing of the whole visual content. The name of the components were lightShining, Glowing, glslRadialBlur, rgbOffset, Overexpose, feedbackRgbKey, feedbackModes as well as DepthOfField for the 3D objects.
Last but not at least – the logos of One Design Week and the sponsor of the festival Programista; had to be implemented into the projection. There were some approaches to do this but the most logical for me was to use the visual elements I already did for CNNCTR. So I did the logo geometry in 3ds Max and then I imported it in TD where I built operators network for the animation. Then I imported it as a video in the CNNCTR project and I did a button in the interface to trigger it manually. I used a radialBlur GLSL as a transition between the interactive installation and the logo video.
Let’s mention also probably the most important thing in such a big network – optimization. Real-time rendering can be very (or too much) expensive process for the computer so it’s extremely important to test and know what is going on when. Otherwise FPS can go drastically low or a crash can occur during the show. The cleaning and optimization of my network took me about two weeks. During programming all the components I often forgot to look carefully what resources it takes to run my downstream and upstream. And it’s easy to get lost in multi-processing. So those two weeks were for looking back. I looked carefully inside everywhere and I had to re-create some operators relations and to add new conditions and rules. I also added UI buttons to prevent cooking and clear memory if necessary (and sometimes it was). For example too many active users at one time were triggering more things to render so I had to lighten some expensive processes like Phong maps, lights, generative geometry. And of course we also did a lot of tests with the developer of the mobile app Bogdan Kovachev. We had to simulate different conditions, internet networks, mobile devices, operation systems, bots, real users, everything. In the end CNNCTR was proudly running not lower than 26 FPS (with 100 users interacting simultaneously) on 1920 x 2400 resolution.
And I would say few more words about the design of the mobile app CNNCTR. Atanas Dinchev (who also did the sound of the installation) used elements from the visual identity of the festival and created the icon and the app screens. He did a great job about it and I was excited to see our app ready for download at App Store and Google Play.
![]()
All elements were combined together and the interactive projection mapping CNNCTR became reality! It was exciting to see it live for 10 evenings in its huge size on 10 floors from the building! The installation was visited by approximately 6800 people and it was thrilling to see so much reactions to our work! Thanks for the efforts to all involved in this project! Watch the official video trailer here:
… And there’s alternative trailer:
… And drone footage/invert mode:
Photos and screenshots:


(photographers: Maritsa Kolcheva and Liubomir Atanasov)
